

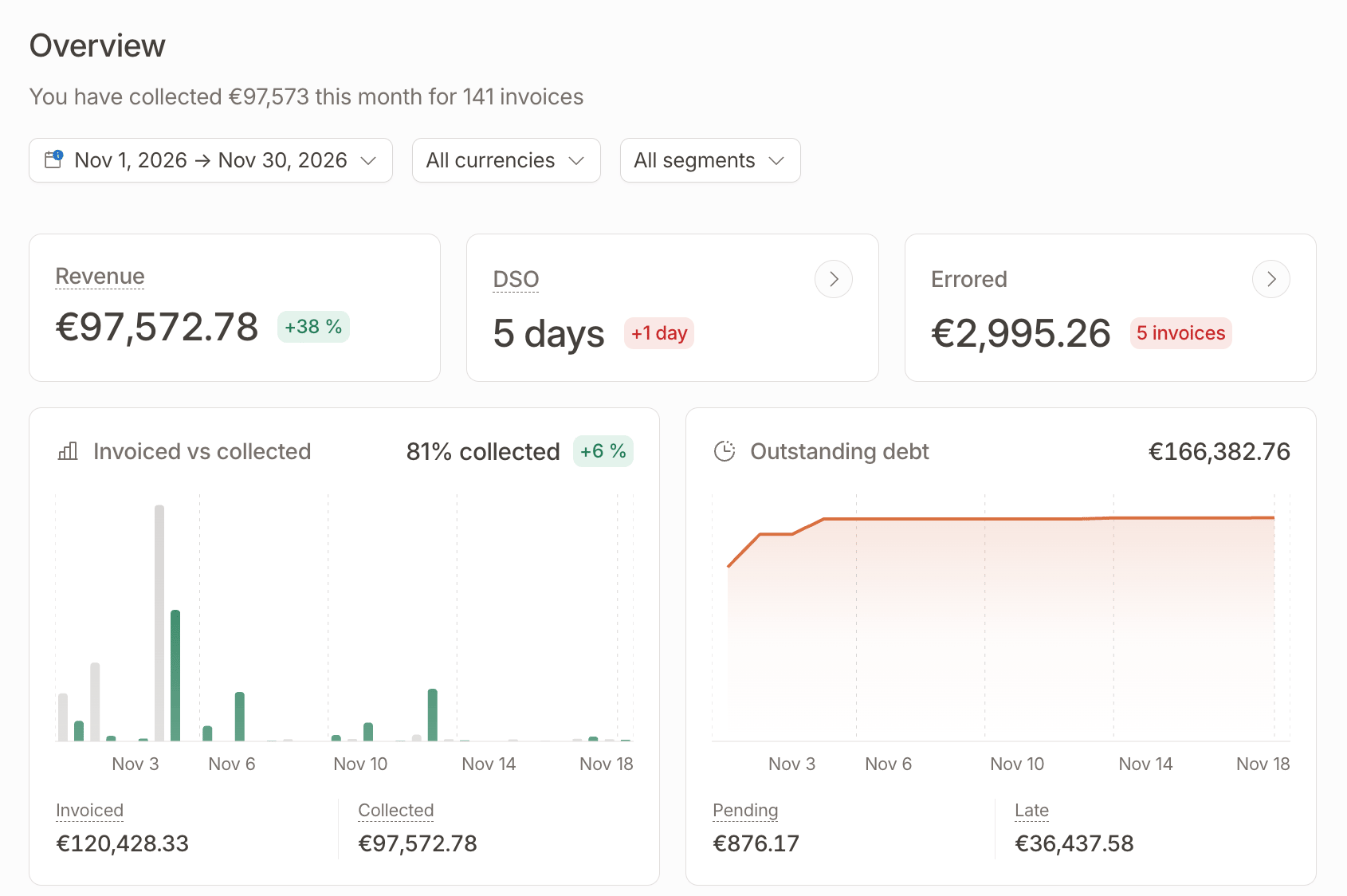
Choose what you see
The selectors at the top of the page define the scope of the overview.- Period sets the time range of the figures. It defaults to the current month. Pick a preset or any date range: figures are compared with the period of the same length just before.
- Currency limits the figures to invoices in one currency. With All currencies, amounts are converted into your account currency. This selector shows only when your account uses several currencies.
- Invoicing entity limits the figures to one invoicing entity. It shows only when you have several entities.
- Segment limits the figures to the customers of one or more segments. It shows only when you have segments.
Key figures
Three cards summarize your collection over the selected period:- Revenue: the payments collected on invoices paid over the period.
- DSO (days sales outstanding): the average number of days between the issue date and the payment date, over the invoices paid in the period. A green change means your customers paid faster than in the previous period. Click the card to open these paid invoices in the invoices list.
- Errored: the amount due and number of invoices in
errorormissing_infostatus. These figures reflect the current state of your invoices, whatever the selected period. Click the card to open these invoices in the invoices list.
Invoiced vs collected
The chart compares, day by day, week by week, or month by month depending on the length of the period:- Invoiced: the total of the invoices issued, by issue date.
- Collected: the payments received, by payment date.
Outstanding debt
The chart shows how the amount your customers owe you evolved over the period, split between Pending (not yet due) and Late (past their due date).This chart uses the same data as the dashboard. It shows only for members with access to the dashboard.
Top outstanding customers
The five customers with the highest outstanding balance, with a bar to compare their amounts. Click a customer to open their unpaid invoices, on the Invoices tab of their customer page.Invoices that need your attention
The bottom of the page lists the invoices you need to act on.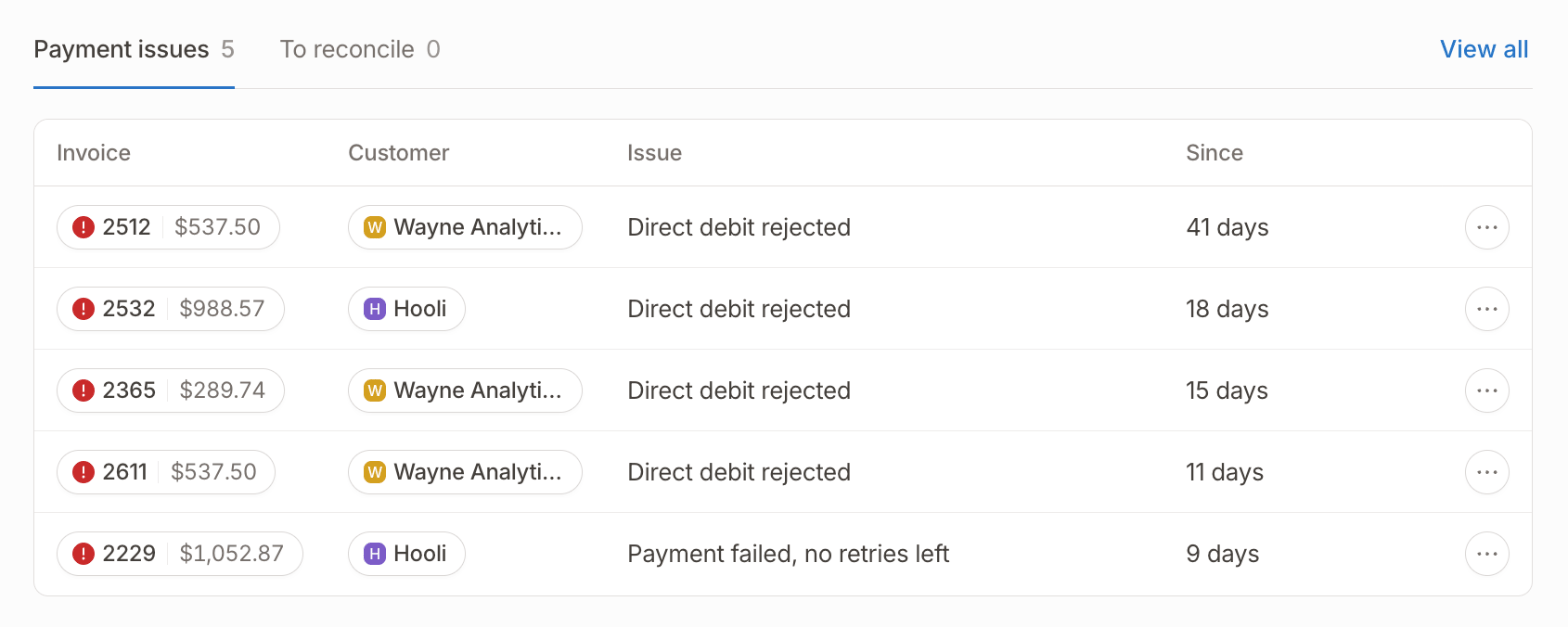
- Payment issues: invoices in
errorormissing_infostatus, with the reason and how long they have been waiting:- Payment failed, no retries left: the last payment attempt failed and Hyperline won’t retry it.
- Direct debit rejected: the customer’s bank rejected the direct debit.
- No payment method on file: the customer has no payment method to charge.
- To reconcile: unpaid invoices with a payment waiting for your reconciliation.