Interactive features
The Insights module includes several interactive capabilities:- Clickable charts and tables: Double-click on any chart bar or table cell to view the underlying data (invoices, transactions, subscriptions)
- Drag to filter date ranges: Click and drag across chart bars to filter data to a specific time period
- Table cell selection: Select multiple cells in financial tables to view aggregated statistics (sum, average, min, max)
- Copy data: Select cells and copy formatted data to your clipboard for use in spreadsheets or reports
This feature is in beta and may incur additional charges. Please contact our support team if you’re interested.
Financial page
The Financial page gives you a clear view of your financial health. It displays your cash flow, MRR and debt evolution, aged balances, and revenue breakdown. You can filter the data by invoicing entity, currency, and date range. Use the date range picker to select preset periods (This month, Last month, This year, Last year, Last 3 months, Last 6 months, Last 12 months, or All time), or choose a custom date range.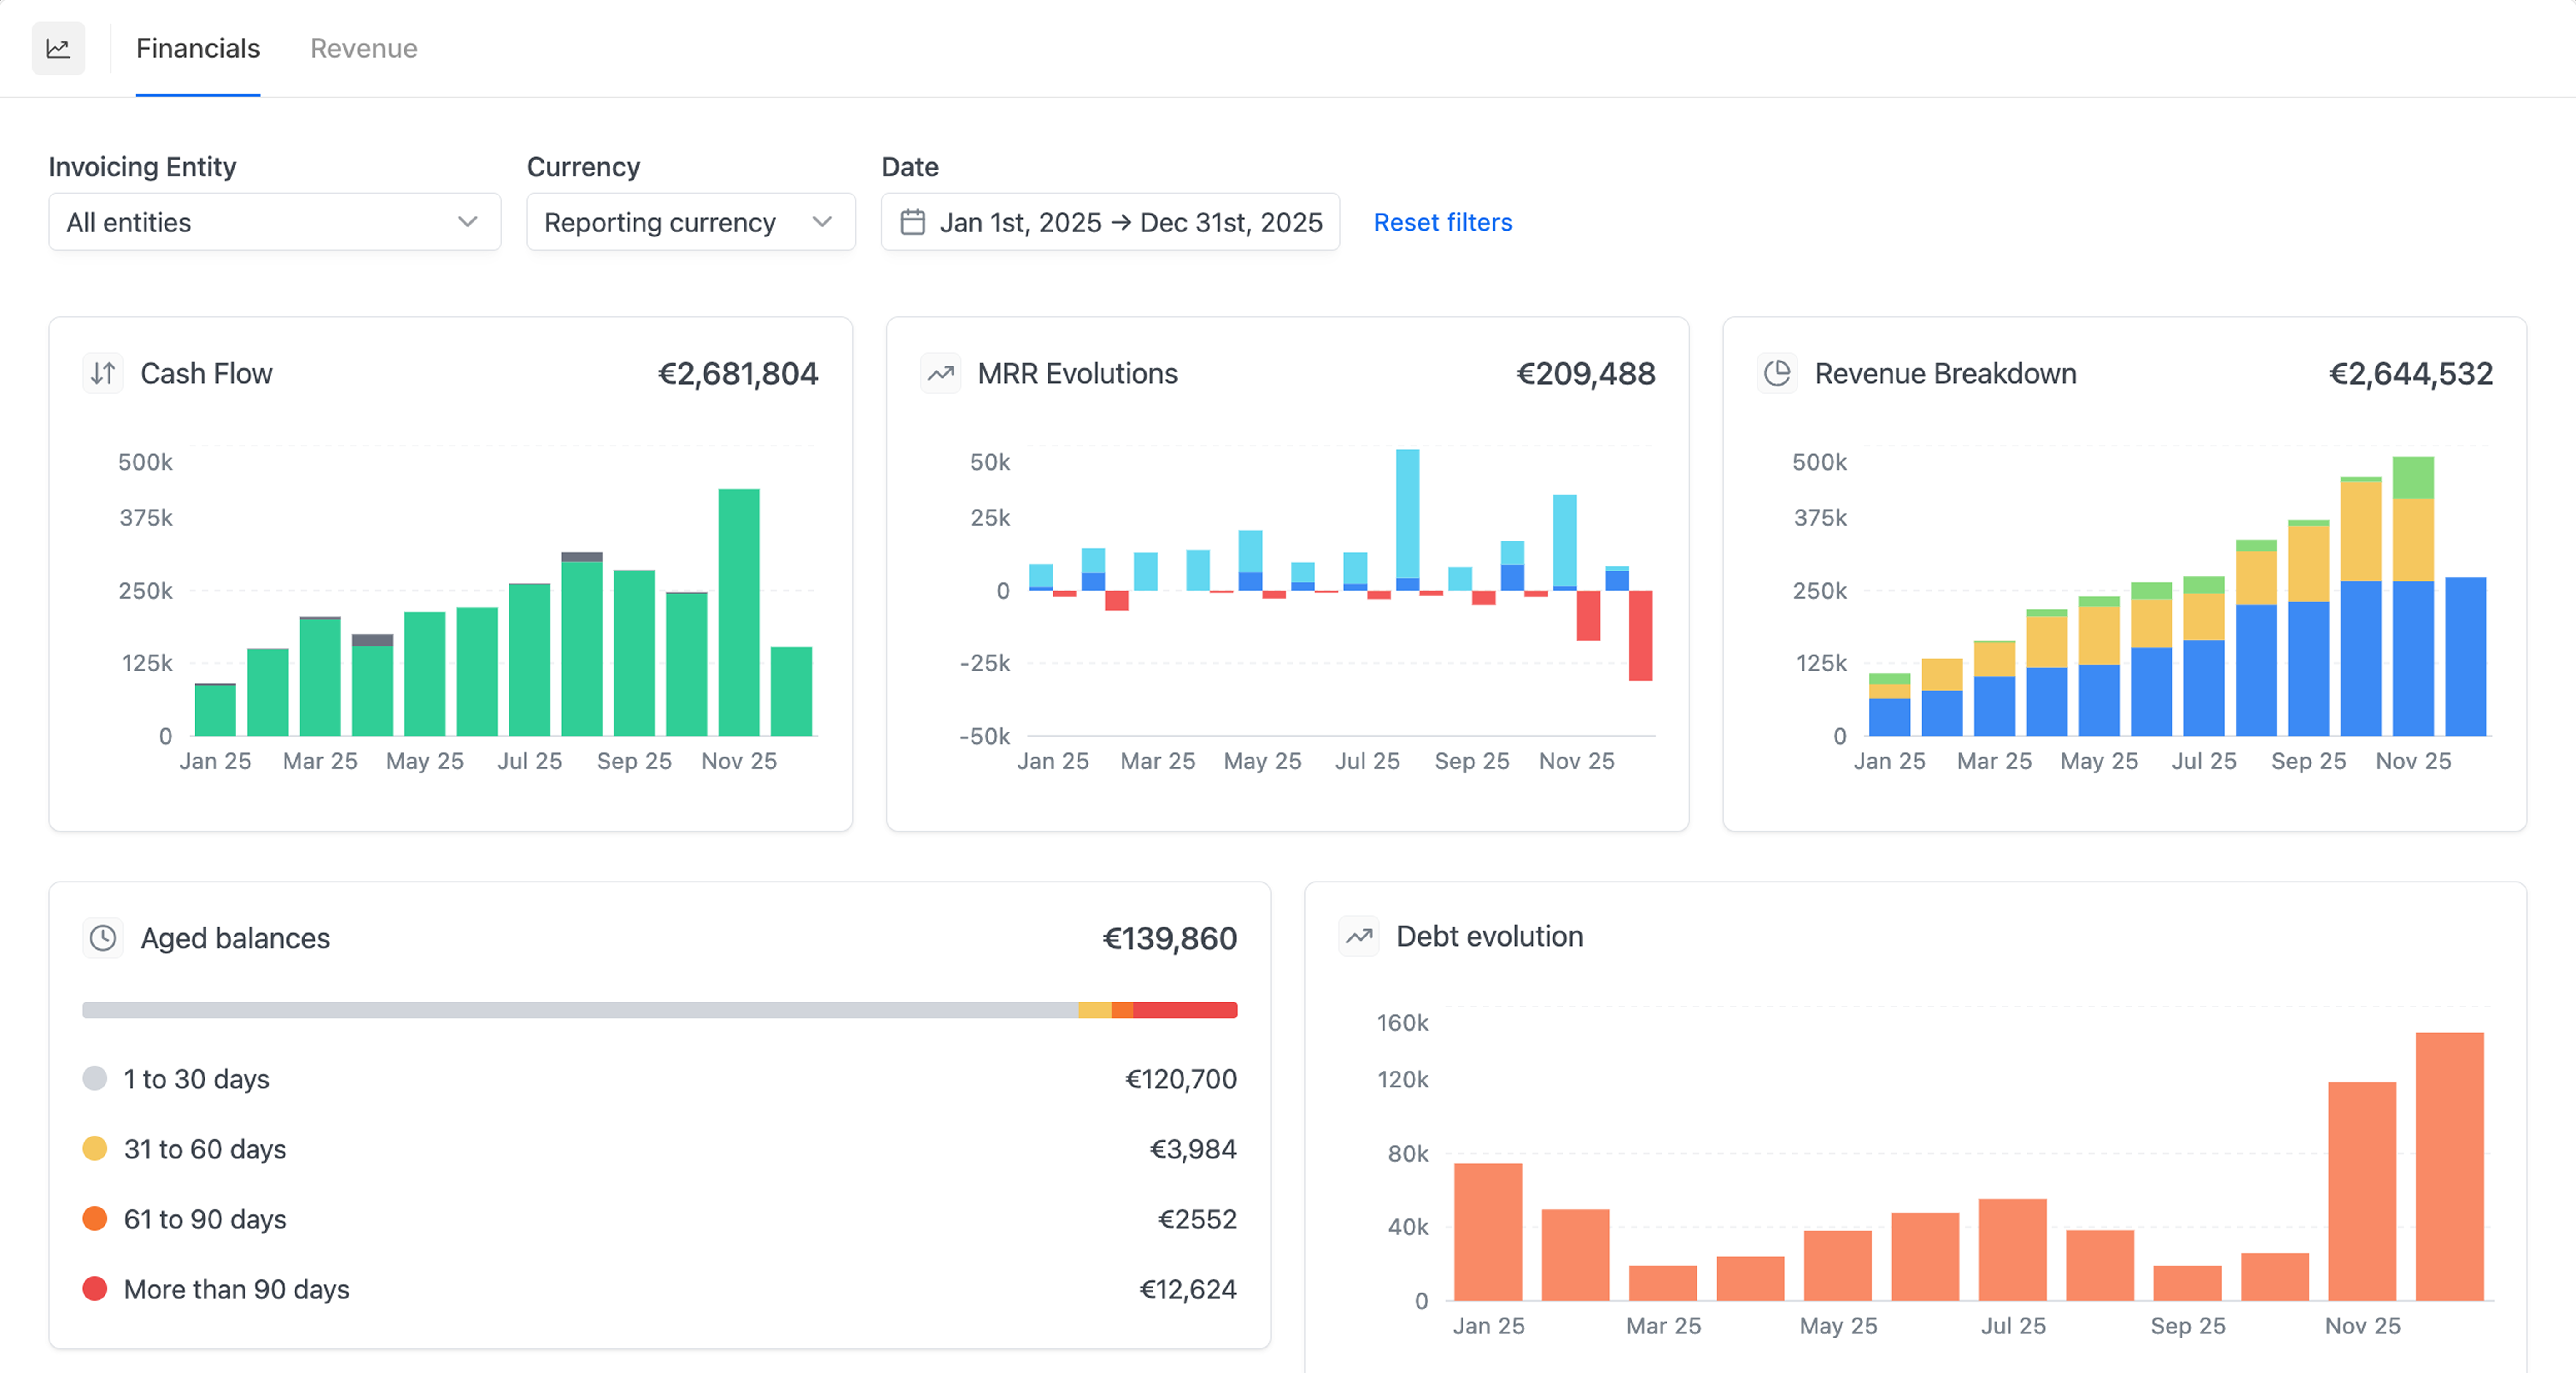
Aged balances
The Aged balances section shows how long invoices have been outstanding, organized by age buckets (1-30 days, 31-60 days, 61-90 days, and 90+ days). The heatmap visualization provides a day-by-day view of outstanding balances, making it easy to identify payment patterns and potential collection issues. Click on any day in the heatmap or any age bucket in the breakdown to view the specific invoices that make up that balance.Accounts receivable
The Accounts receivable section provides a complete breakdown of your outstanding balances. Accounts receivable figures are based on when invoices are sent and their current status, while cash figures reflect when payments are actually received.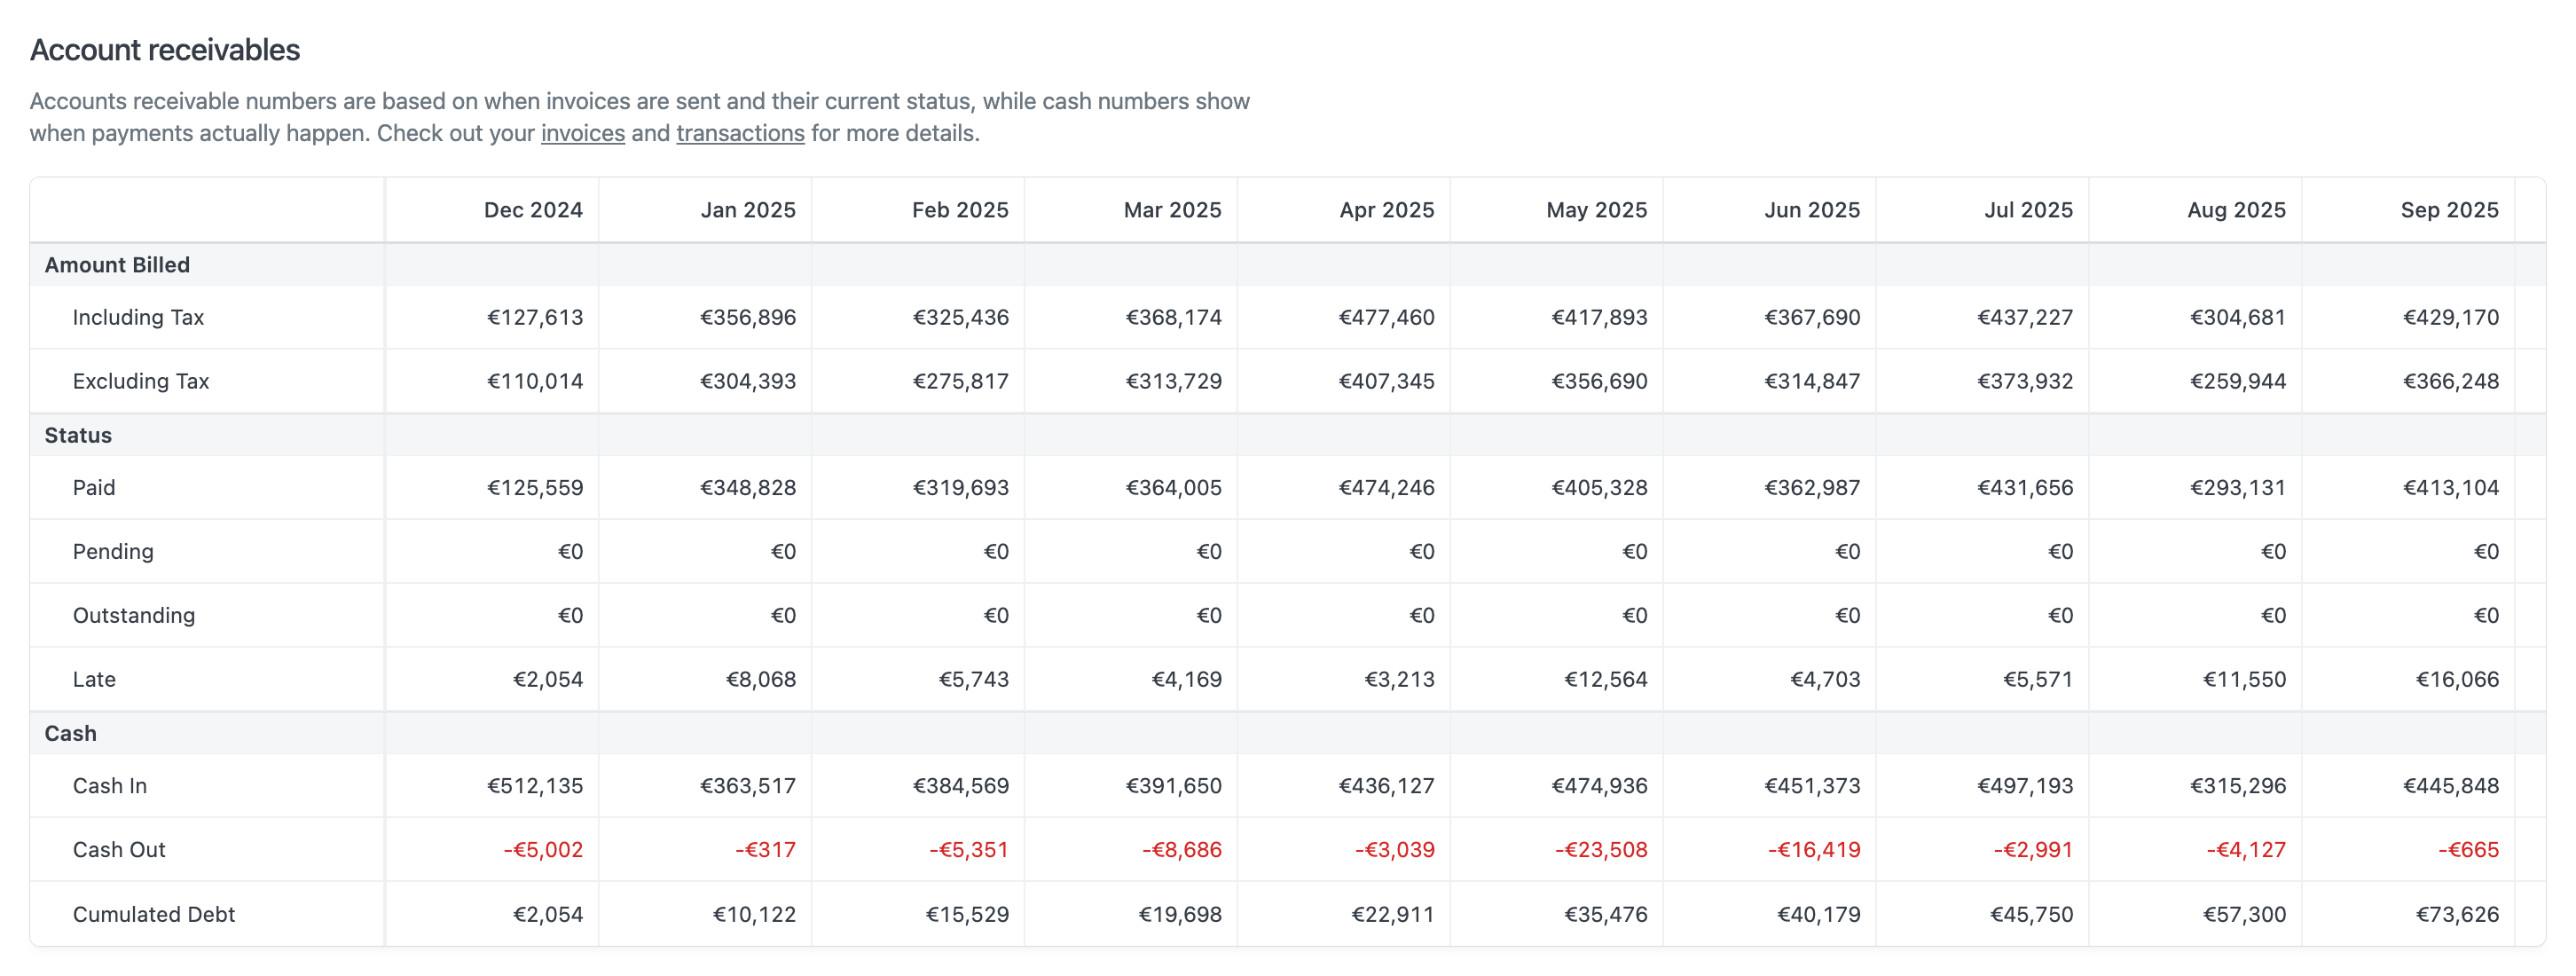
Aged balances
The Aged balances section includes a heatmap visualization that shows overdue invoices by the number of days past due. Each cell in the heatmap represents a specific day and displays the total outstanding amount for invoices overdue by that many days. Click on any cell to drill down into the invoice-level details for that specific day range. The heatmap supports filtering by:- As of date: Calculate balances as of a historical date to see how your aged balances looked at any point in time
- Invoicing entity: Filter by specific invoicing entities
- Currency: View amounts in original currency or reporting currency
- Invoice status: Filter by invoice status (to pay, paid, etc.)
Aged balances show what’s outstanding at a specific moment in time, so the only time input that affects the heatmap and its drilldown is As of date. The
1-30 days bucket excludes invoices that are still within their payment terms: a recent unpaid invoice whose due date has not yet passed is not counted in that bucket.MRR financials
The MRR financials section offers a detailed breakdown of your Monthly Recurring Revenue. Billed MRR is derived from invoice line items based on the service period start date and billing interval, normalized to monthly amounts. Expansion and contraction reflect contract changes, while new and lost represent contracts that started or ended. Variable revenue includes usage-based charges or credits, as well as committed revenue.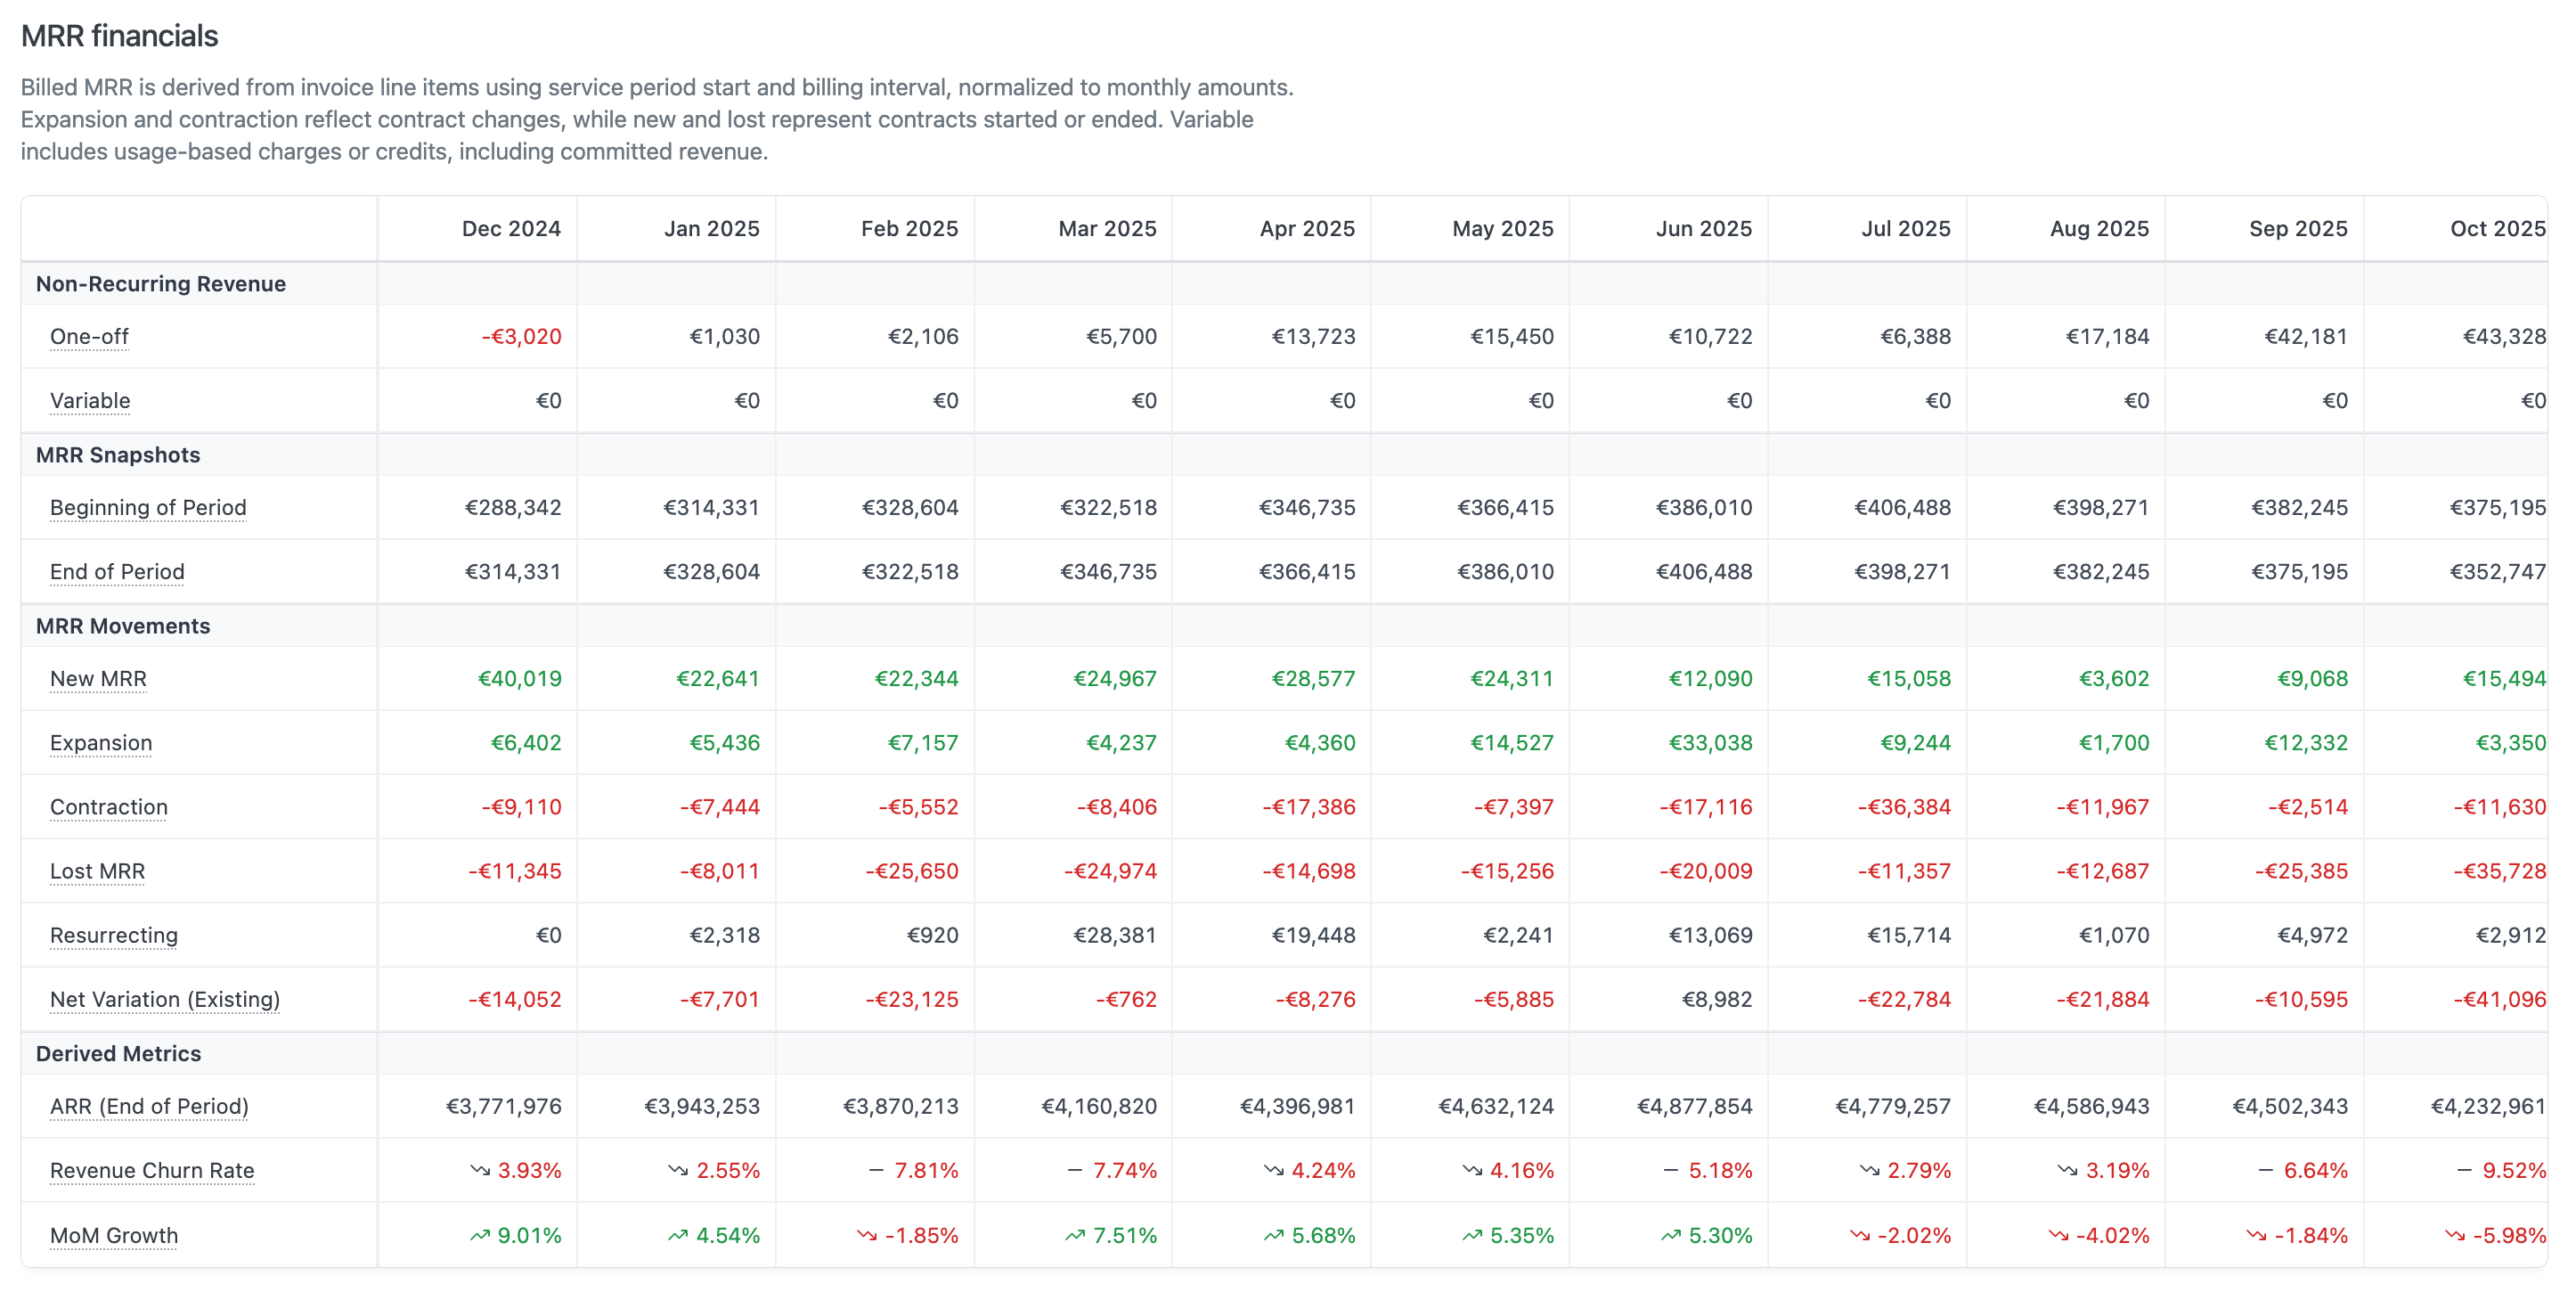
How MRR is computed
- Proration and partial cycles: charges that cover only part of a billing cycle (mid-cycle upgrades, cancellations, partial first months) contribute a prorated share of MRR based on how much of the cycle they cover. An 8-day charge on a monthly plan adds roughly 8/30 of a month’s MRR, not a full month.
- Credits and refunds: credit notes and negative lines within an invoice (for example, a prorata refund issued alongside an upgrade) are subtracted from MRR.
FX rate methodology
For customers billed in a currency different from your reporting currency, MRR is normalized using the customer’s most recent invoice’s conversion rate, applied uniformly across their entire MRR history. This approach is aligned with market practices for SaaS analytics.Why a single rate per customer? Each invoice captures the FX rate that applied when it was issued. For accounting, that is the correct rate to use — it reflects what was booked at the time. For recurring revenue analysis, using a different rate each month introduces noise: the same £10,000/month customer can appear to expand or contract as GBP/EUR moves, even though nothing about their subscription changed. Anchoring each customer’s MRR history to a single conversion rate removes that noise.Things to keep in mind:
- Historical MRR values are recomputed each time the dashboard is loaded. As conversion rates move, the same past month can show slightly different values between views. Each view is internally consistent, just anchored to a different current rate.
- For foreign-currency customers, MRR figures in Insights will not match the amounts in your accounting export line-for-line. This is intentional: the accounting export reflects historical bookings in your accounting currency, while Insights normalizes FX to give a stable business-trend signal.
Revenue page
The Revenue page provides in-depth insights into your revenue streams, including revenue by geography, recurring revenue evolution, and the breakdown between committed and variable components. You can filter the data by invoicing entity, currency, date range, customers, and products. Use the date range picker to select preset periods (This month, Last month, This year, Last year, Last 3 months, Last 6 months, Last 12 months, or All time), or choose a custom date range. Use the Clear filters button to reset customer and product filters.
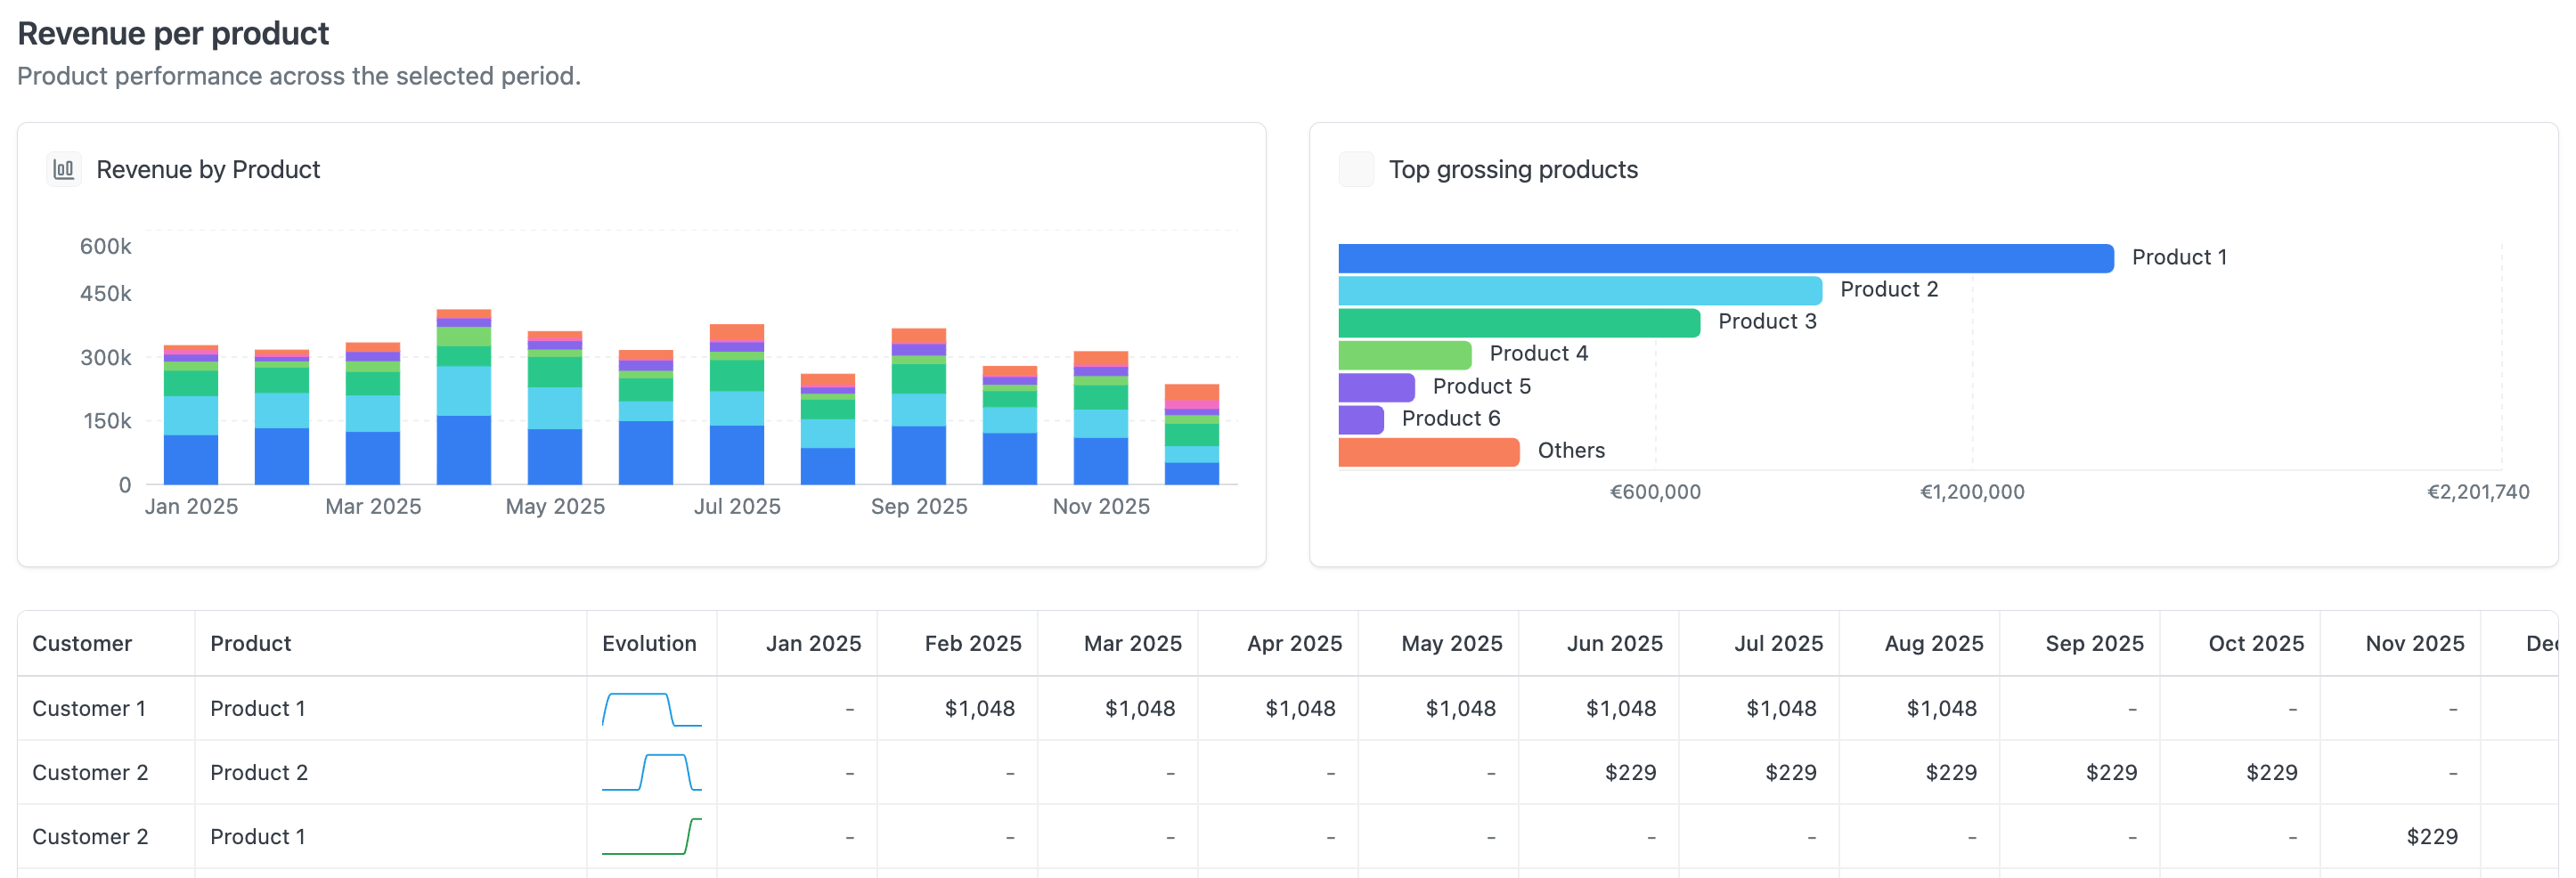
Product & customer breakdown
The Revenue per product section provides a detailed breakdown of your revenue by product and customer. Use this section to track the performance of each product and monitor revenue evolution over time per customer. The revenue table supports infinite scrolling for large datasets and includes:- Interactive selection: Select multiple cells to view aggregated statistics
- Sparkline charts: Each row displays a mini chart showing revenue trends over time
- Invoice drilldown: Double-click any cell to view the invoices that contributed to that revenue