The health sections (tiers, distribution, dimensions, and score changes) require Customer intelligence and a monitoring agent that scores your customers. Without it, the page shows the customer figures and your top customers.
Choose what you see
The selectors at the top of the page define the scope of the overview. View sets whose customers are included:- All customers (default): every customer in your account.
- Me: the customers you own.
- My team and Me and my team: available to managers, based on the manager set on each team member.
- A team member: search a person to see only their customers.
Customer figures
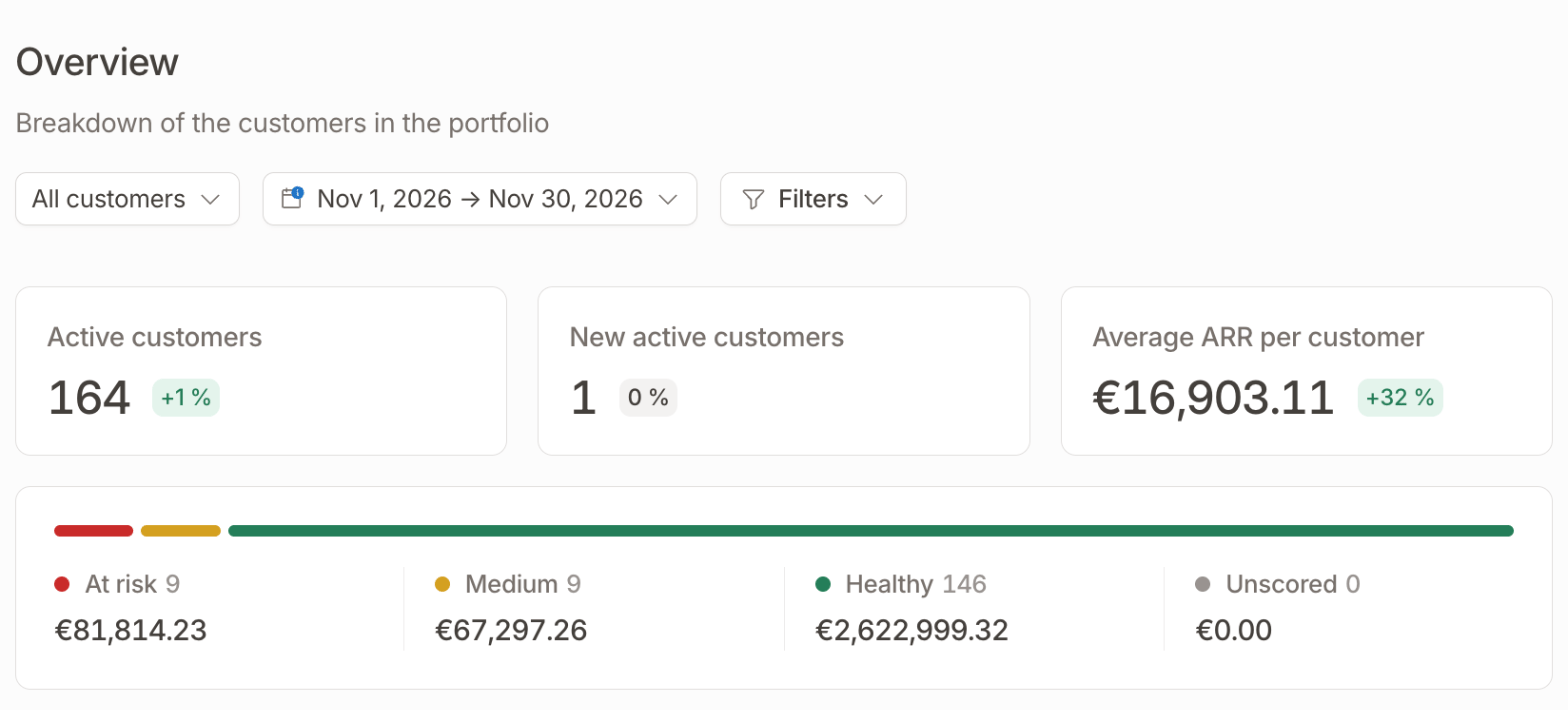
Three cards summarize your portfolio over the selected period:- Active customers: customers with at least one active subscription at the end of the period.
- New active customers: customers who became active during the period.
- Average ARR per customer: the estimated ARR of your active customers, from their active and pending subscriptions, divided by their number.
Health tiers
Your active customers are grouped by their latest health score at the end of the period:
Each tier shows its number of customers and the estimated ARR they represent. You set the score range of each tier in your customer settings, under Health score tiers.
Click a tier to open its active customers in the customers list.
Health distribution over time
Two charts show, week by week, the share of your customers and the share of your ARR in each tier. Use the ARR chart to see whether the revenue at risk grows, even when the number of customers at risk stays flat.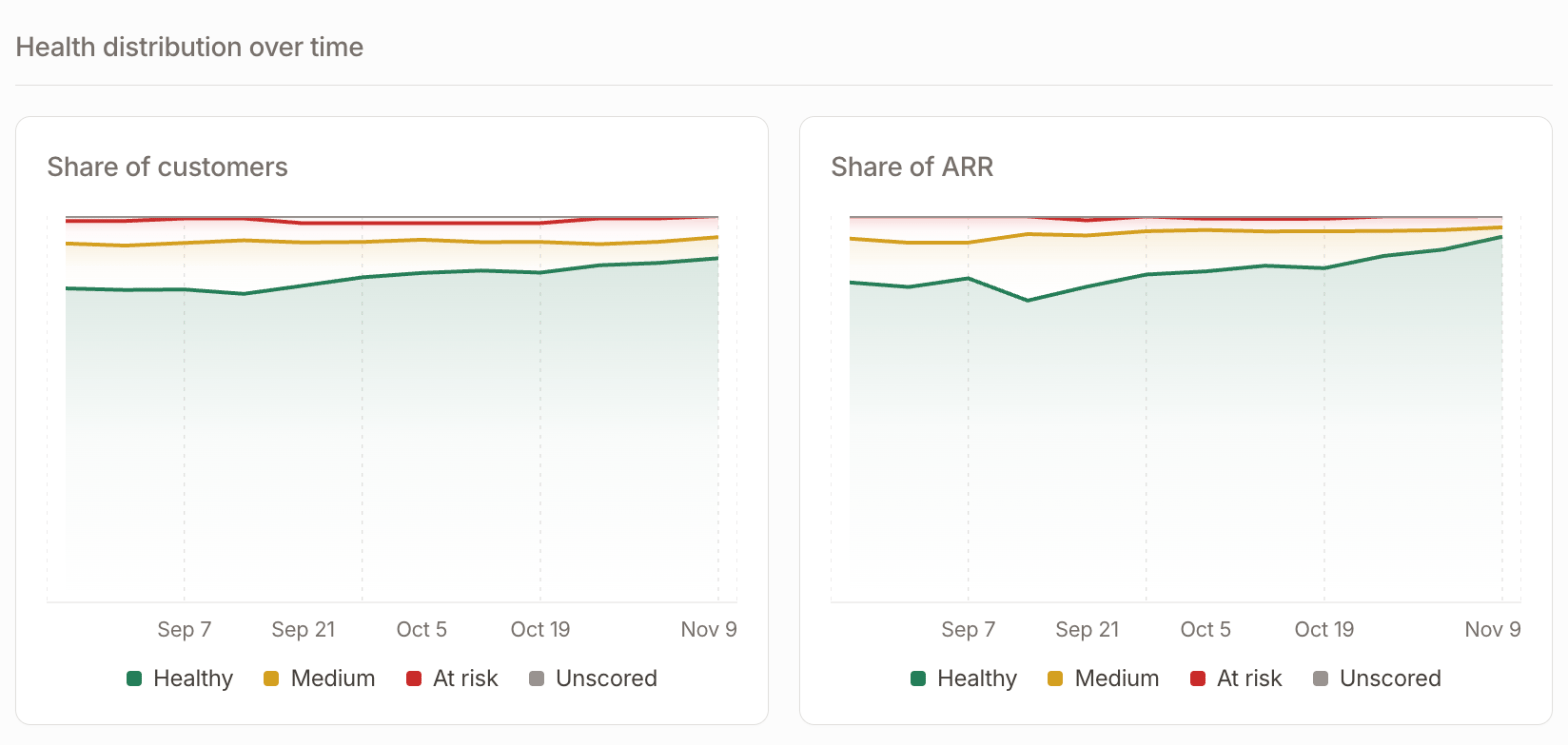
Dimension details
The health score combines five dimensions: Payments, Usage, Contract, Support, and Communications. For each one, you see the average score of your customers, its change over the period, and how customers are distributed across tiers. Hover the distribution to see the details.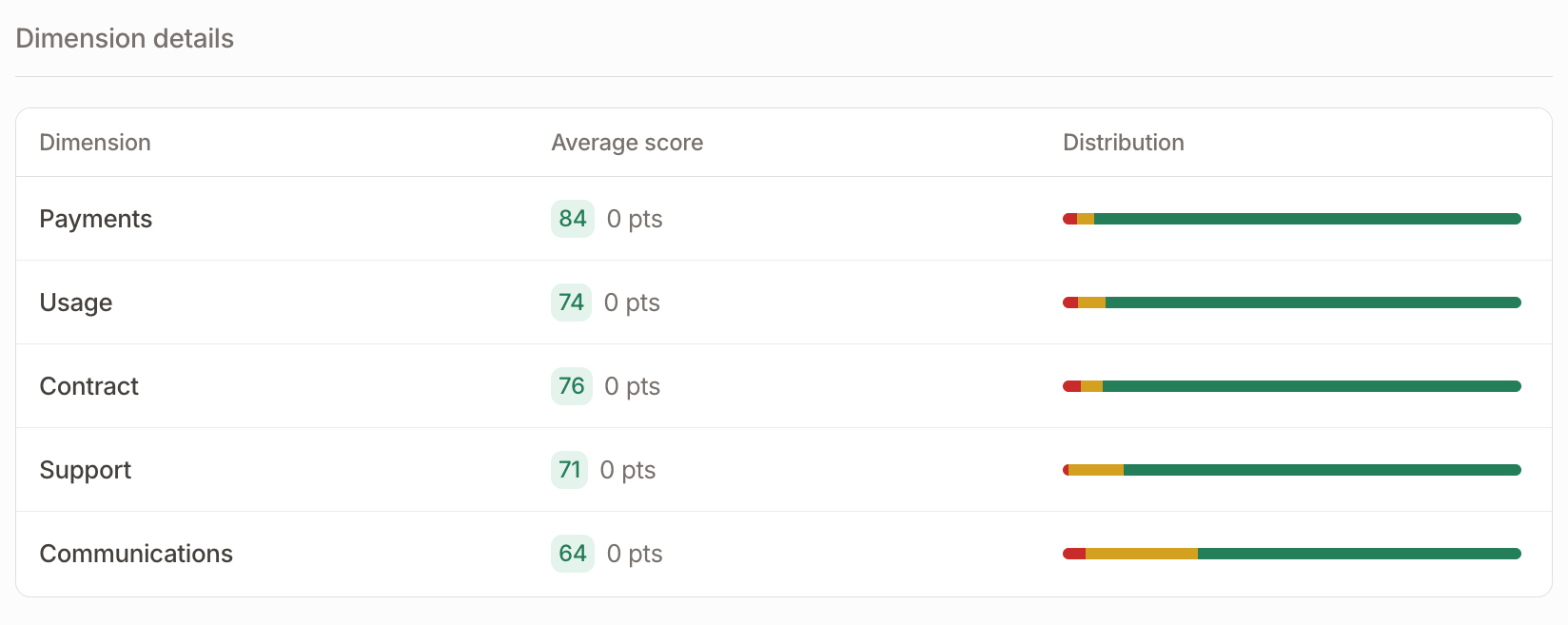
Health score changes
Health score declines and Health score improvements list the customers whose score moved by 5 points or more over the period, largest change first. The change compares the customer’s score at the start of the period with their latest score at the end. A score that dropped and came back during the period doesn’t appear. Each row shows the date of the latest score, the change, and the customer’s estimated ARR.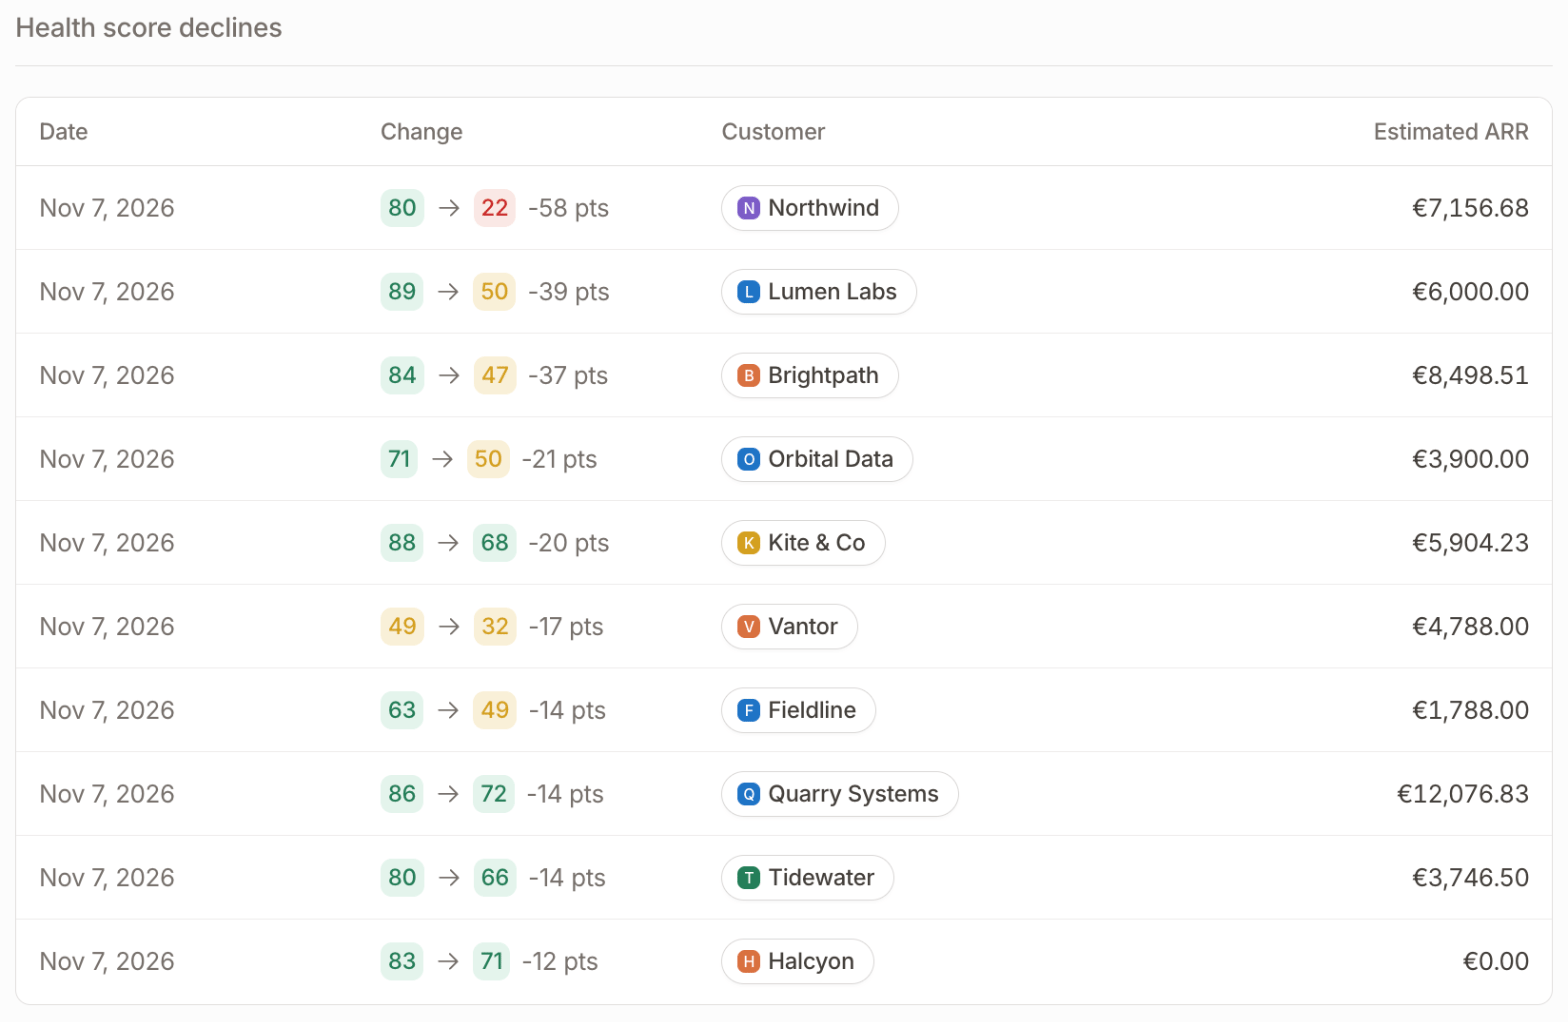
Top customers
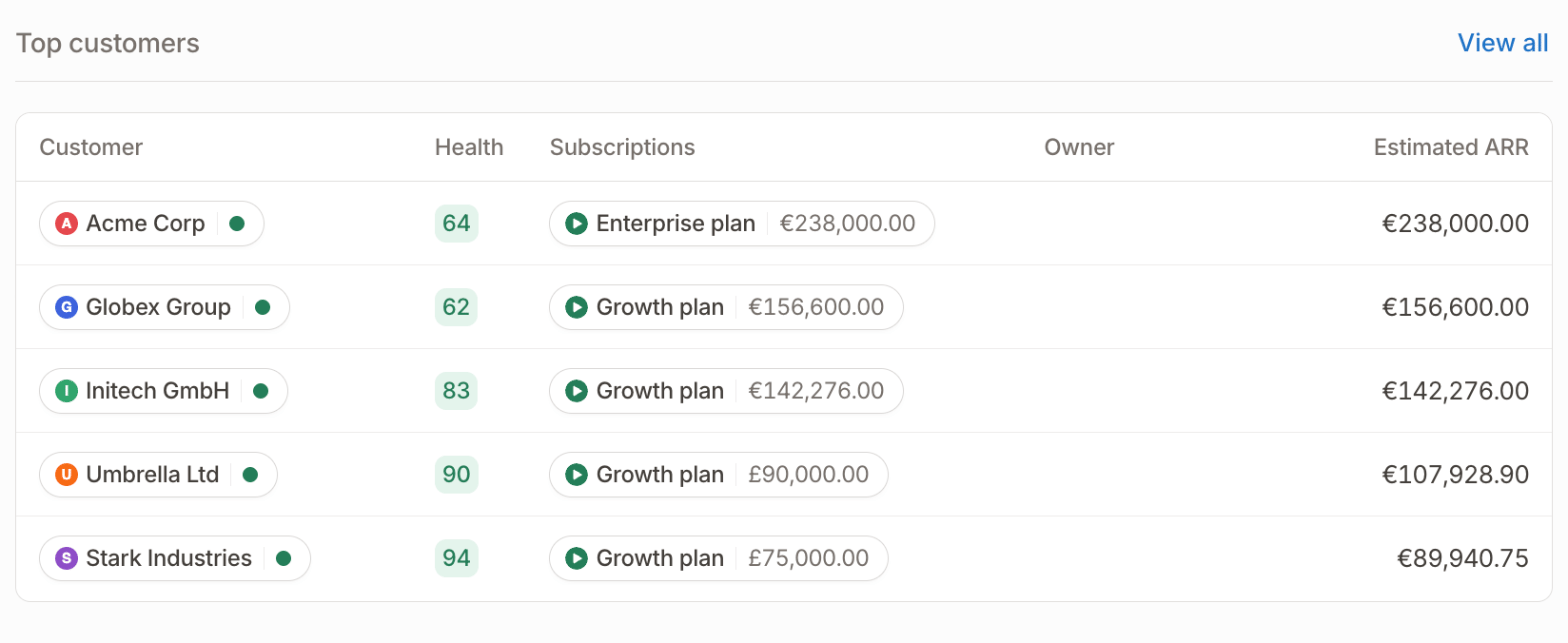
Your five largest active customers by estimated ARR, with their health score, subscriptions, and owner.